


In this recipe, you'll learn how to do two things:
- Calculate the average first reply time (the time between when a ticket is created and the firstpubliccomment on the ticket by an agent).
- Create a second report showing tickets that exceed the average first reply time.
This recipe contains the following sections:
- What you'll need
- How to create the average first reply time report
- How to create the report showing tickets that exceed the average first reply time
What you'll need
技术水平:Intermediate
Time Required:15 minutes
- Zendesk Explore Professional or Enterprise
- Editor or Admin permissions (seeGiving agents access to Explore)
- Ticket data in Zendesk Support
How to create the average first reply time report
In this first report, you'll create a report that returns the average first reply time for your agents.
To create the report
- In Explore, click the reports (
 ) icon.
 - In the Reports library, clickNew report.
- On theSelecta datasetpage, clickSupport>Support -Tickets,然后单击Start report. The report builder opens.
- Next, add your metrics, the things you want to measure. In this case, you'll add the number of tickets created. In theMetricspanel, clickAdd.
- From the list of metrics, chooseDuration between events - Calendar hours (min)>第一次回复time (min),然后单击Apply. Explore displays the average first reply time in minutes for all tickets.
- Now, you'll filter the report to display only the average first reply time for agents. In theRowspanel, clickAdd.
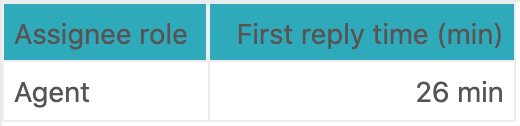
- From the list of attributes, chooseAssignee>Assignee role,然后单击Apply. Explore displays a table showing the average reply time in minutes for each role.
- Click theAssignee roleattribute you just added. In theSelectedtab of theAssignee rolepanel, ensure onlyAgent被选中。
- When you are finished, clickApply. Explore displays the average first reply time in minutes for all of your agents, in this case 26 minutes. You'll need this number for the next report.
- Make sure to give this report a name and save it. You'll come back to it from time to time to adjust your average first reply time in the next report.

How to create the report showing tickets that exceed the average first reply time
In this second report, you'll report on tickets that exceed the average first reply time you discovered in the first report (in this example, 26 minutes).
To create the report
- In Explore, click the reports () icon.
- In the Reports library, clickNew report.
- On theSelecta datasetpage, clickSupport>Support - Tickets,然后单击Start report. The report builder opens.
- In theCalculationsmenu(
 ), clickStandard calculated metric.
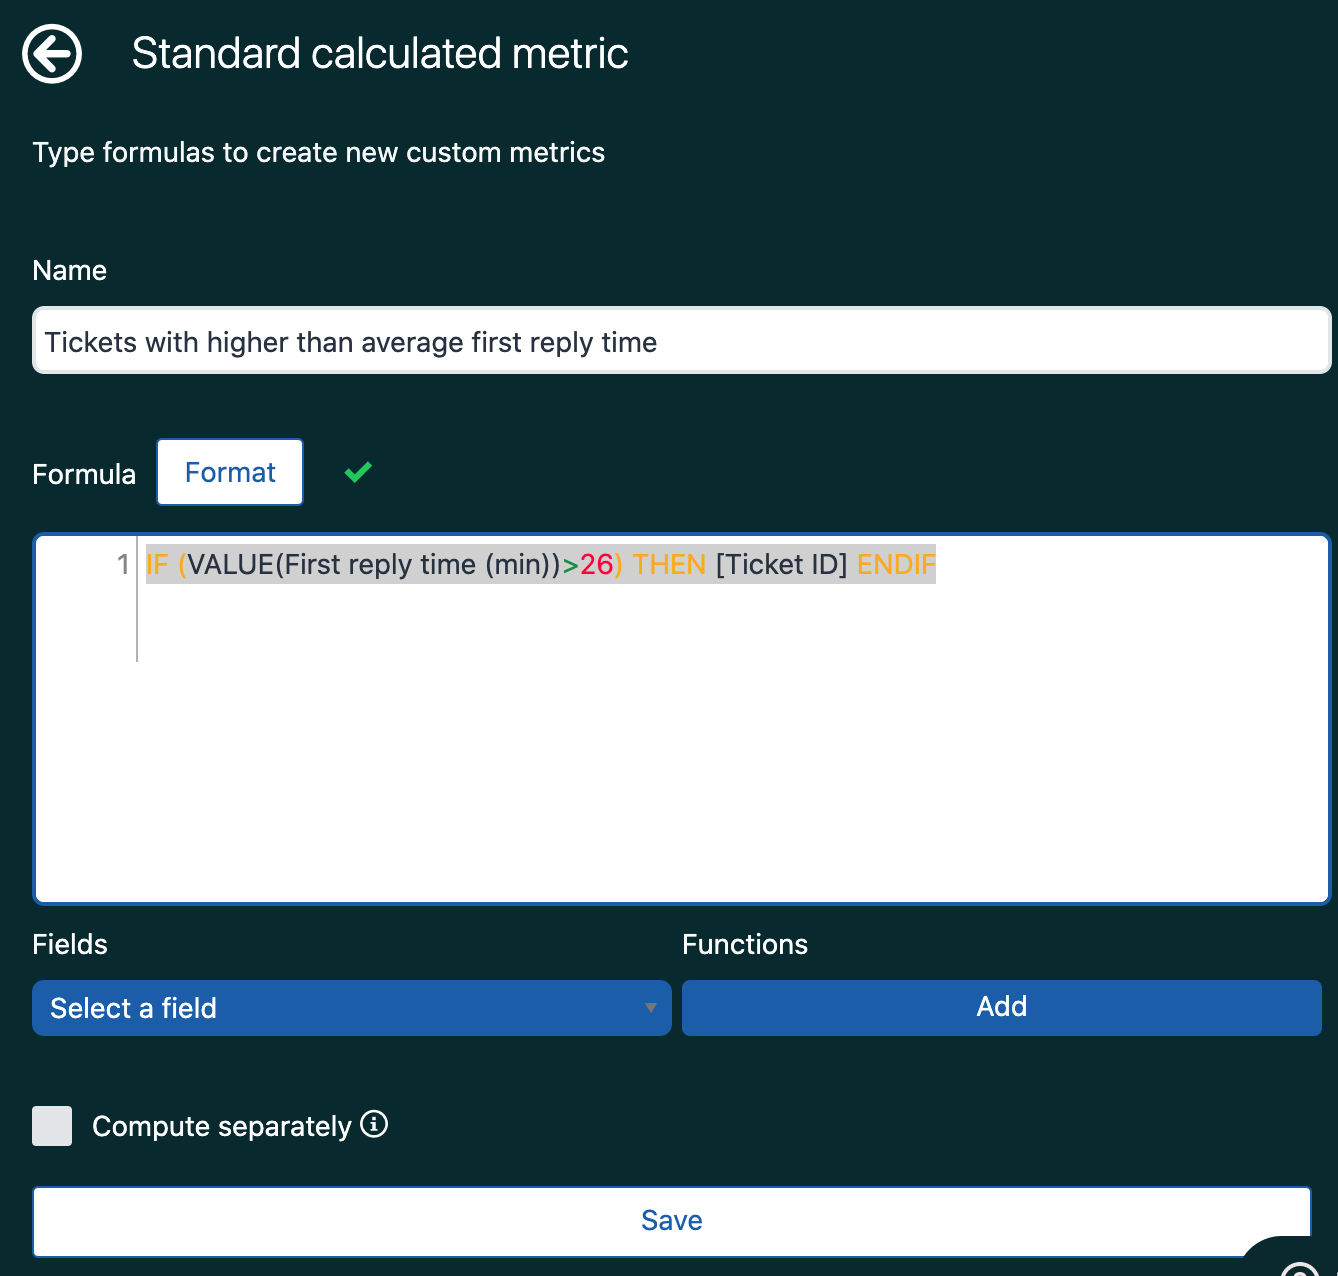
 - On theStandard calculated metricpage, enter or paste the following formula:
IF (VALUE(First reply time (min))>26) THEN [Ticket ID] ENDIF
(remember to replace "26" with your own average first reply time) - Enter a name for the formula like "Tickets with higher than average first reply time".
- When you are finished, clickSave.
- In theMetricspanel, clickAdd.
- From the list of metrics, chooseCalculated metrics>Tickets with higher than average first reply time(the metric you just created), then clickApply. Explore displays the number of tickets with a higher than average first reply time.
- Now, you'll add a few attributes to help you understand which tickets are getting slower first reply times. In theRowspanel, clickAdd.
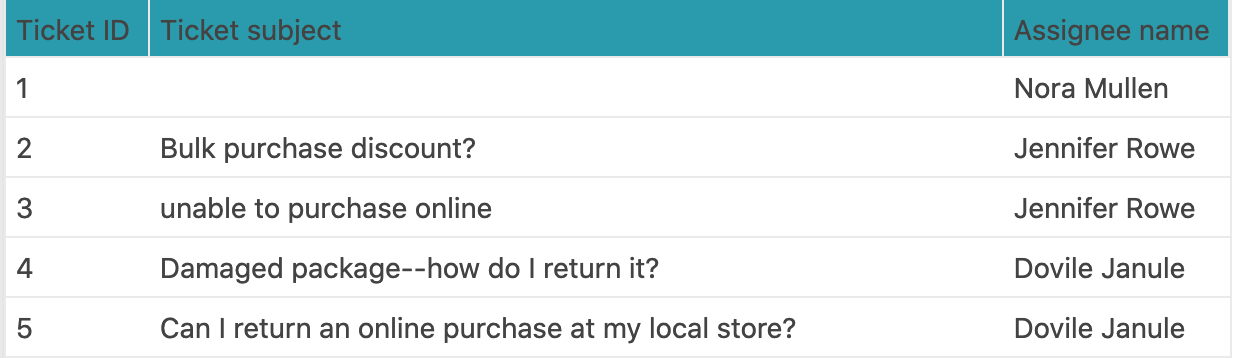
- From the list of attributes, chooseTicket>Ticket ID,Ticket>Ticket subject, andAssignee>Assignee name. Explore displays a table showing the ticket IDs, subjects and assignee names on any tickets that took longer than the average first reply time.


Continue to monitor your average first reply time. You'll probably need to adjust the formula in this report from time to time.
0 Comments
Pleasesign into leave a comment.