


Note:Sell customers who also have a Suite Professional plan or higher may also create this report.
In this Explore recipe, you’ll learn how to create a funnel report to analyze deal progression through the sales pipeline. This helps you see how many deals are incoming, how many are in contract negotiation, and so on.
This article contains the following topics:
What you’ll need
技术水平:Beginner
Time required:5 minutes
- Zendesk Explore Professional or Enterprise
- Editor or Admin permissions (seeGiving users access to Explore)
- Sales data in Zendesk Sell
Creating the report
- In Explore, click theReports(
 ) icon.
 - In the Reports library, clickNew report.
- On the选择一个数据集page, clickSell>Sell - Sales,然后单击Start report. The report builder opens.
- In theMetricspanel, clickAdd.
- From the list, selectDealsand then clickApply.
- In theColumnspanel, select the following attributes and then clickApply:
- Deal stage position in sales funnel
- Deal stage in sales funnel
- In theResult manipulation(
 ) menu, selectResult path calculationand fill out the following fields:
- Pattern:Running total
- Path:On columns
- Aggregation:和
- Starting point:Last element
- ClickApply.
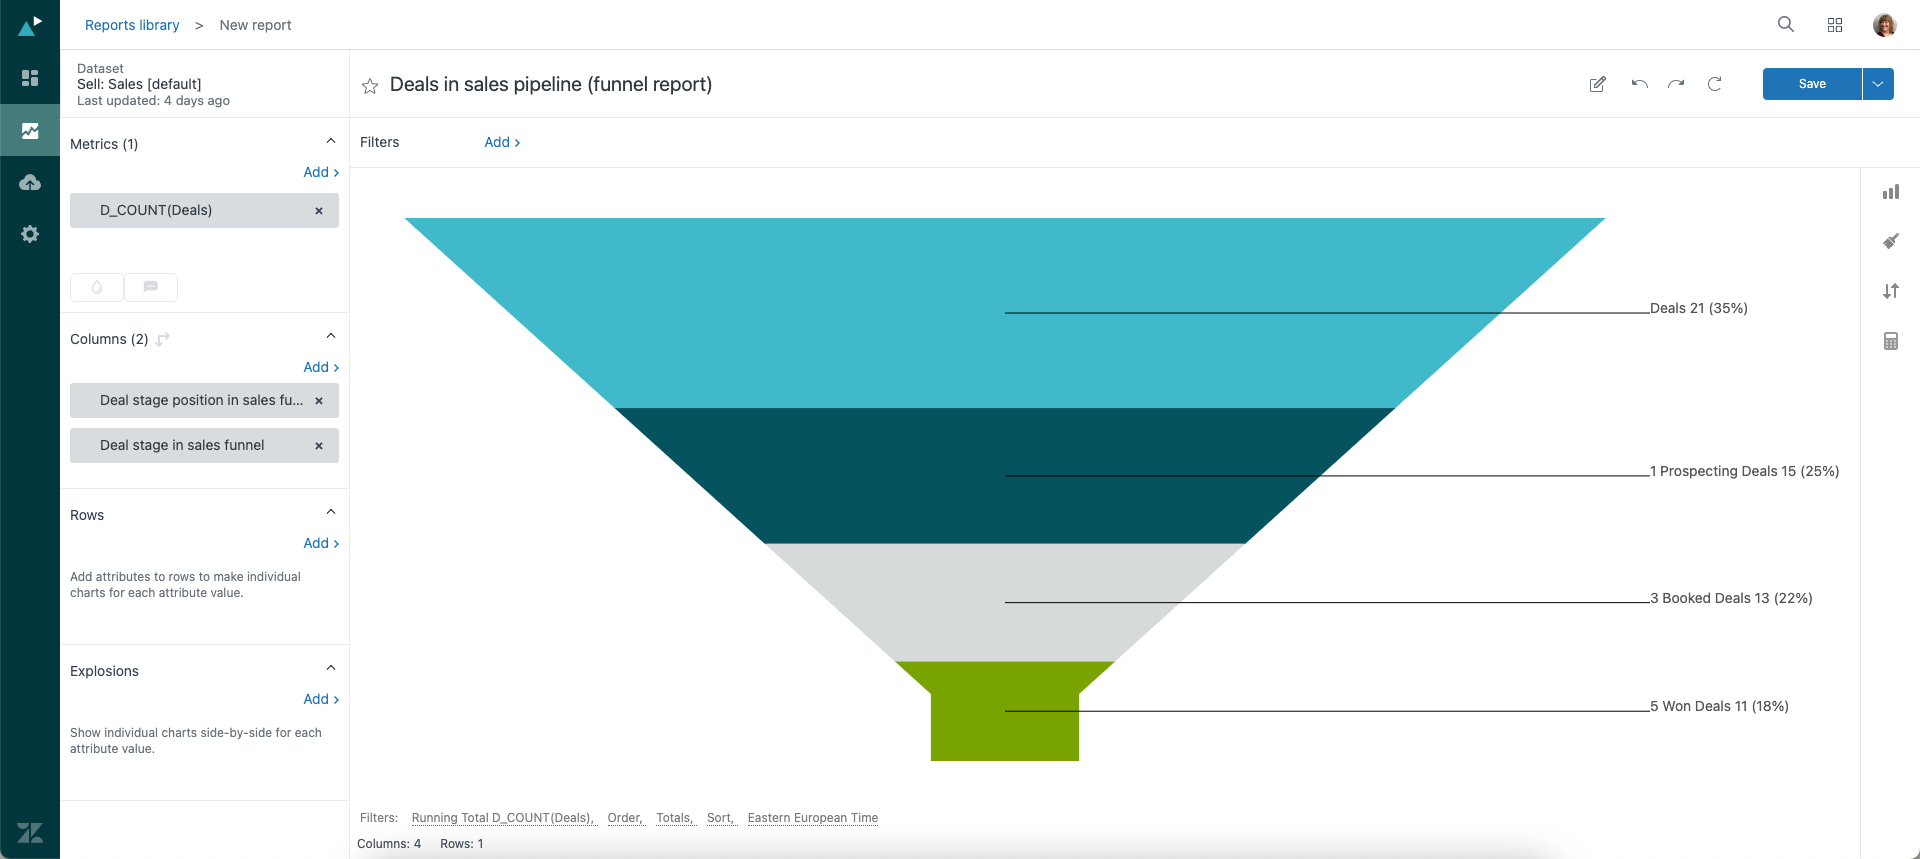
- In theVisualization type(
 ) menu, selectFunnel.
1 Comments
Hi,
I have a simple question. My dashboard has a date filter and two reports: A KPI for the no. of added- and a KPI for the no. of converted leads. I want to create a custom metric to calculate the ratio between the added- & converted leads. If there were 100 added leads in a week, and 20 converted, the expected output is 20%.
When I set the date filter, all the reports are automatically updated. Now the tricky part: added leads depend on time - lead created - date. Converted leads depends on time - lead converted - date. This means the ratio between the two figures will always be either 100% or 0%.
How would it change if I added Added Deals & Won Deals where the time depends on time - deal created - date & time - deal closed - date?
Pleasesign into leave a comment.