


This recipe demonstrates you how can usedashboard filtersto quickly change configurations on dashboard reports. You can then save different configurations asbookmarks. Bookmarks enable dashboard viewers to switch between different dashboard configurations with a single click.
In this example, you'll set up a number of reports that track ticket updates and comments over the past year. You'll add these to a dashboard and then create achange attribute filterthat enables viewers to change the time period looked at between years, months, and days. Finally, you'll create bookmarks that let the viewer switch between these time measurements with a single click.
This article contains the following topics:
What you'll need
Skill level:Advanced
Time required:30 minutes
- Zendesk Explore Professional or Enterprise
- Editor or Admin permissions (seeGiving agents access to Explore)
- Ticket and agent data in Zendesk Support
Creating the reports
In this first section, you'll create the following reports and add them to a new dashboard:
For all reports
For each report you create, use this procedure to get started:
To create the report
- In Zendesk Explore, click the reports (
 ) icon.
 - In the Reports library, clickNew report.
- On theSelect a datasetpage, clickSupport>Support -Updates history, and then clickStart report.
The report builder opens. Continue working through each procedure in turn.
Report 1 - Tickets created
In this first report, you'll create a column chart that displays the number of tickets created by month and year.
To create the report
- In theMetricspanel, clickAdd.
- From the list of metrics, chooseTickets>Tickets created, then clickApply.
- In theColumnspanel, clickAdd.
- From the list of attributes, chooseTime - Ticket update>Update - yearandTime - Ticket update>Update - Month, then clickApply.
- From the Visualization type menu (
 ), chooseColumn.
 - ClickSave, and then clickAdd to dashboard

- On theSave new report topage, selecta new dashboard例如,和给您的仪表板起一个名字Bookmarks dashboard.
- When you are finished, clickSave.
Report 2 - Tickets solved
In this report, you'll create another column chart. This chart displays the number of tickets solved by month and year.
To create the report
- Create a new report using the first procedure above.
- In theMetricspanel, clickAdd.
- From the list of metrics, chooseTickets>Tickets solved, then clickApply.
- In theColumnspanel, clickAdd.
- From the list of attributes, chooseTime - Ticket update>Update - YearandTime - Ticket update>Update - Month, then clickApply.
- From theSavemenu, clickSave.
- From theSavemenu, clickAdd to dashboard
- On theSave new report topage, choosean existing dashboard, then choose your dashboard,Bookmarks dashboardfrom the list
- When you are finished, clickSave.
Report 3 - Agent comments
In this report, you'll create another column chart. This chart displays the number of ticket comments from agents by month and year.
To create the report
- Create a new report using the first procedure above.
- In theMetricspanel, clickAdd.
- From the list of metrics, chooseComments>Agent Comments.
- In theColumnspanel, clickAdd.
- From the list of attributes, chooseTime - Ticket update>Update - YearandTime - Ticket update>Update - Month, then clickApply.
- From theSavemenu, clickSave.
- From theSavemenu, clickAdd to dashboard
- On theSave new report topage, choosean existing dashboardand choose your dashboard,Bookmarks dashboardfrom the list
- When you are finished, clickSave.
Optional reports
If you want to see totals as well as time trends, you can additionally add Key Performance Indicators (KPIs) for the metrics.
Create each of these reports using theSupport: Updates history [default]dataset and add them to your dashboard in the same way as you did the three reports above.
- A report with a single metric,Tickets>Tickets created.
- A report with a single metric,Tickets>Tickets solved.
- A report with a single metric,Comments>Agent comments.
If you need more help creating reports, seeCreating reports.
Customizing the dashboard
You'll find your new dashboard ready to go in the Dashboards library (![]() ). However, you'll need to do a bit more work to get it looking just right.
). However, you'll need to do a bit more work to get it looking just right.
To customize the dashboard
- Open the dashboard, then clickEdit. The dashboard opens in edit mode.
- ClickTab options.
- In theTab optionsmenu, clickSize: fit to one screen(
 ), then clickAutomatically reorganize widgets(
 ).
). - Click CTRL-A (Windows) or Option-A (Mac) to select all the reports (widgets) on the dashboard.
- UnderWidget options, clickHide/Show header(
 ). This removes the title header from each report.
 - To show the label on each KPI chart, perform the following steps for each KPI chart:
- In the KPI chart, click the arrow, then chooseEdit report. The report builder opens with the KPI report loaded.
- In the chart configuration menu (
 ), clickChart.
 - On theChartpage, uncheckHide label.
- Save the report to return to the dashboard.
- Organize the dashboard by dragging and resizing each report until it looks similar to the example screenshot below:

Configuring dashboard filters
In this section, you'll create two dashboard filters. Atime filterchanges the time period of the results shown on the dashboard. Thechange attributefilter enables you switch the x-axis attribute being used for the column charts between month, week, and date.
Add a time filter
In this section, you'll add a time filter to your dashboard that lets dashboard viewers select the date range displayed by the dashboard.
To add a time filter
- In your dashboard, clickAdd
- From the list of widgets, chooseadd time filter.
- On theTime filter widgetpage, select the first attribute,Updates history [default] - Update(this corresponds to theTime - Ticket updategroup of attributes).
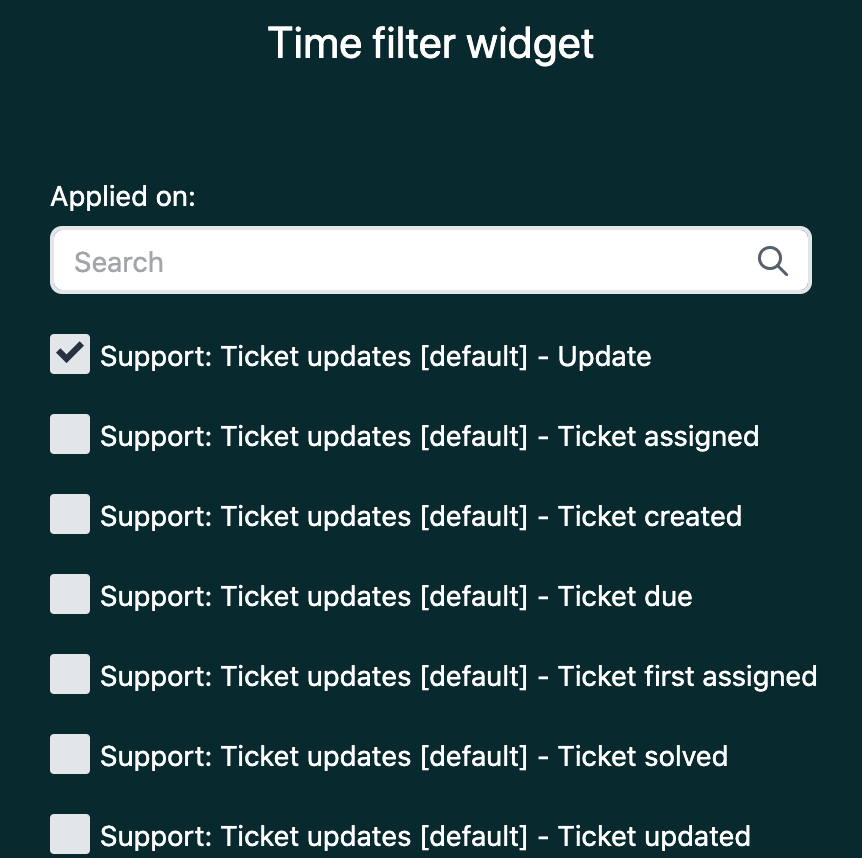
- From theRender asdrop-down list at the bottom of the widget page, chooseAdvanced ranges. This gives you access to both simple and advanced date ranges in your time filter widget.
- ClickClose.

Now, when you preview your dashboard, you'll see that you can use the time filter to select a simple or advanced date range. When you select a range, the dashboard updates to reflect the new time period. Now, you'll add a change attribute filter. This attribute lets you change the attribute being reported on fromUpdate - monthto a different attribute.
Add a change attribute
To add a change attribute
- In your dashboard, clickAdd
- From the list of widgets, chooseAdd change attribute.
- On theChoose change attributepage, selectUpdate - Month. The change attribute is displayed and dashboard viewers can replace theUpdate - Monthattribute with any other month.
- From theDisplaydrop-down list on theChoose change attributepage, chooseIn a button list.
- In theRestrict to this list of attributesenter the following attributes. These will be the only change attributes displayed to the end user:
- Update - Month
- Update - Week of year
- Update - Date

- Move the change attributes widget so you can see it and the time filter next to each other.
You've now completed this section and viewers can use the time attribute to alter the duration of the whole dashboard, or the change attribute to report by month, week of year, or date. You can set any combination of values you want. In the next section, you'll learn how yo can save reports you've configured using dashboard filters by usingbookmarks.
Setting up the bookmarks
In this section, you'll set up three bookmarks that viewers to use to switch between three different time periods and levels of detail with a single button click rather than having to configure multiple features:
- Monthly for the past 12 months
- Weekly for the past 12 weeks
- Daily for the past 30 days

Monthly view
To set and bookmark the monthly view
- In the time filter widget, set the date range to be from 12 months in the past to 1 month in the past.
- In the change attribute widget, chooseUpdate - Month.

- From the dashboard menu, clickAdd>Add bookmark.
- On theBookmarkpage, clickCreate bookmark from current stateand name it12 month view.
- Click the pin button to make this the default dashboard configuration.

- ClickClose.

Weekly view
To set and bookmark the weekly view
- In the time filter widget, set the date range to be from 12 weeks in the past to 1 week in the past.
- In the change attribute widget, chooseUpdate - Week of year
- In the bookmark widget you previously created, click the top-right corner menu, then clickEdit.
- On theBookmarkpage, clickCreate bookmark from current state. A new, blank bookmark is created.
- Name the new bookmark12 week view, and then clickClose.

Daily view
To set and bookmark the daily view
- In the time filter widget, set the date range to be from 30 days in the past to yesterday.
- In the change attribute widget, chooseUpdate - Date
- In the bookmark widget you previously created, click the top-right corner menu, then clickEdit.
- On theBookmarkpage, clickCreate bookmark from current state. A new, blank bookmark is created.
- Name the new bookmark30 day view, and then clickClose.

Finishing up
To finish the dashboard
- Hide the time filter and change attributes widgets. In top-right corner menu of each widget, clickHide.
- Move the bookmarks widget to a clear space on the dashboard.

- Rearrange the dashboard to look similar to the example below:

Dashboard viewers can now switch between dashboard configurations with a single click.
9 Comments
Hi Rob, "Update - Month" is no longer available under the "Change Attribute" widget. Would you please update your article to include the current attributes found in Zendesk Explore? Thank you.
HiEric Haley, thanks for the feedback. I did a review of the doc and while I made a few small updates, I was able to use Update - Month with the change attribute widget.
Are you using the Ticket updates dataset? (I'm presuming you're good there). The other possibility might be that you haven't added the necessary metrics and attributes to your query yet?
If either of these don't work, let me know and I'll open a ticket so that someone can investigate this further with you. Thanks!
Hi Rob Stack, thanks for getting back to me. It looks like we're seeing two different things. I'm following your directions above for "Add a change attribute." In your directions, you state the following:
Where your screenshot above shows "Update - Month" under "Choose change attribute," my dashboard shows me the following. I'm using the Tickets Created in my dashboard. Is this why I'm seeing this? The menu displays something different if you use the Tickets Created metric? What if I used both in my dashboard? What would the menu look like then? Display both? Thanks for your time.
HiEric Haley, you're welcome and sorry we haven't gotten to the bottom of this yet. I'm going to open a ticket for you so one of the team can investigate what's going on with you. You should hear from someone soon.
Thank you, Rob. I appreciate it.
嘿,我有一个问题关于使用data set filter here. For context, I've built a dashboard that compares agent ticket/chat data up against the team average. However, I want to easily send out this dashboard to multiple agents so they can see what their totals are per week. The problem I'm running into is that when I filter the entire dashboard by assignee/agent name, the team average reports also change. Is there a way around this?
All good, figured it out!
Hi Everybody,
I have an issue with this bookmarking thing.
We have 8 tabs which are sharing 5 filters together . I would like to setup one filter with bookmarks and leave the rest as it is . But if I setup a bookmark it's save a status like 4 filter are on empty value and the 5. has value . The issue with this concept is that the empty value is saved as well .
So if we are reviewing the dashboard on our weekly meeting and we setup some filtering on the first tab , 1-4 filter then we are changing the tab it's loading again the empty values .
Is there any workaround of this issue when you saving a bookmark only for one filter instead of all of them .
I hope my issue is understandable . If not I would try to clarify it more .
Thank you in advance,
Patrik
What you're seeing is the expected behavior of bookmarks. I'm afraid it's not possible to associate only one filter with the bookmark and prevent the other filters from being reset.
一个解决方案,你可以探索是使用custom attribute (astandard calculated attributeor acustom group/set attribute) to replicate the the bookmarked values in your filter. You can add this custom attribute as data filter and use it in place of the bookmark in your dashboard.
Pleasesign into leave a comment.