

This series outlines best practices for Guide admins who want to use the insights provided by Google Analytics to create the best self-service experience possible for customers.
Zendesk Support's own analytics are a great place to start. But let’s face it, Google knows a thing or two about analytics. The谷歌分析service it provides has tools for everything from search analytics to ticket-deflection tracking. You can use these tools to improve your self-service option and make it easier and faster for your customers to find answers.
This is the first article in the series. It outlines how to use Google Analytics to answer questions you may have as a Guide admin responsible for providing an effective self-service support option to your customers.
- Getting started
- How many of my customers use self-service?
- How engaged are the customers who use self-service?
- Should I tailor my content for new or existing customers?
- Is my content relevant?
- Should I improve my site navigation?
- Should I optimize my help center for mobile devices?
The series covers the following topics:
- Part 1 - Asking the right questions - YOU ARE HERE
- Part 2 -Measuring the effectiveness of search
- Part 3 -Tracking customers' actions
- Part 4 -Fine-tuning your help center
- Part 5 -Capturing help center user data
The series only scratches the surface of the things you can do with Google Analytics. There are plenty of resources to learn more. After you're finished here, another great resource isOccam’s Razor, Avinash Kaushik’s blog on everything web analysis and analytics.
Getting started
Before you do anything, enable Google Analytics for your help center, seeEnabling Google Analytics.
In your谷歌分析dashboard, navigate toAudience>Overview.

The Audience Overview page provides high-level metrics about users of your help center.

It’s important to measure if you're actually achieving what you set out to change, especially when you’re launching your help center. You can use the user metrics to track and trend how your customers are interacting with your help center. You can also gauge whether the updates you make to themes, navigation, or content actually improve the self-service experience for your customers.
The following sections describe how to use the Google Analytics dashboard to answer questions you have as a Guide admin responsible for providing an effective self-service option to your customers.
How many of my customers use self-service?
Use this metric:Users.
Usersis the number of unduplicated (counted only once), users of your help center over a specified time period. Zendesk Support’s Help Center analytics tracks the number of article and question views, but a customer may view multiple pages during a session. The Users metric counts each session as one session even if the customer views multiple pages. The information helps you understand how many of your customers are actually using your self-service offering.
Keep an eye on this metric over time to see trends. For example, which days get more help center users? Is the number of users increasing as your customers become more familiar with your help center?
You can take it a step further by calculating your self-service score. The self-service score is defined as the number of users who attempt to use content made available by the company to solve an issue, divided by the number of users that submit a request for an answer:
Self-service score = Total users of your help center(s) / Total users in tickets
To calculate your score, take the total users of your help center from Google Analytics, and divide it by the total unique requesters in tickets. Compare your score with theZendesk Benchmark Reportto see how you stack up against your industry peers. The average score for companies using Zendesk is 4.1, which means that for every four customers who attempt to solve their own issues using self-service, one customer submits a support request.
How engaged are the customers who use self-service?
Use this metric:Avg. Session Duration
Avg. Session Durationis the average duration of a session in your help center. It measures how much time on average a customer spends in your help center during one session. The metric is a good measure of the level of engagement when your customers are seeking self-service.
The average session duration depends on your use case and your customers. For example, the average session duration of B2C businesses in the retail and telecommunication industries may be shorter than B2B businesses that have customers with more complex questions.
Should I tailor my content for new or existing customers?
Use this metric:% New Sessions
% New Sessionsis an estimate of the percentage of first-time sessions to your help center in the period selected. Knowing whether your customers are new or returning visitors can help you better tailor your content to meet their needs.

Often, the majority of sessions for B2B and internal use cases are returning customers. These customers are more accustomed to skipping through superfluous introductory content to get to the articles that answer their in-depth questions. If you know most of your users are returning customers, you can use your help center as another vehicle for delivering relevant news and announcements.
On the other hand, if you have a high number of new customers, you may want to tailor your content for users just getting started with your product or service.
You can also drill down in the% New Sessionsmetric by help center categories, sections, articles, or questions. Use the information to map the content that's used by first-time users and returning ones.
Is my content relevant?
Use this metric:Bounce Rate
One way to determine whether or not your content is relevant for your customers is by measuring the opposite -- how irrelevant is it?Bounce Rateis the percentage of single-page sessions in your help center. A "bounce" means the customer left the first page without engaging with the page.
Customers may leave after viewing only one page for different reasons. Maybe they couldn't find what they needed, or maybe the first page had everything they needed! How can you tell the difference? For articles, it’s completely acceptable and expected to see a high bounce rate. Customers may be finding what they need in the article and getting back to work. For "table of contents"-type pages that link to other articles, a high bounce rate could mean customers aren't finding what they're looking for.
In the Google Analytics dashboard, navigate toBehavior>Site Content>Landing Pages.登陆页报告列表页面顶部r customers are landing on. Look for high bounce rates on "table of contents"-type pages, such as category or section pages. These pages tend to get a high number of sessions. If one also has a high bounce rate, consider making changes to it to improve information discovery.
Should I improve my site navigation?
Use this metric:In-Page Analytics
In-page Analyticslets you see the links users click the most on each page in your help center. The information can provide insights into your most popular content as well as uncover problems with customers not following links to your most important content.
Before you start, make sure In-Page Analytics is configured correctly:
- In Google Analytics, click theAdmintab at the top of the page.
- In the Property column with your help center selected, selectProperty Settings.
- ForDefault URL, make sure the default URL starts with HTTPS, not HTTP, if you have a help center.
- ForDefault Website, make sureAll Web Site Data被选中。
- In the In-Page Analytics section, selectStart In-Page Analytics In>Full View Mode.
- ClickSave.
To view the in-page analytics for a page
- In the Google Analytics dashboard, navigate toBehavior>Site Content>All Pages, then select the landing page that you want to analyze.
- Click theIn-pagetab on the upper side of the dashboard.
The page you selected loads in a separate window with an overlay of click data. You can essentially walk in your customers’ shoes by navigating through each page of your help center and seeing where your customers click and how frequently certain links get clicked. Example:

The information helps you better understand what customers are looking for and what they may be struggling to find. Typically, links and content placed higher on a page (known as "above the fold"), get a higher percentage of clicks. Whenever possible, place links to your most important content above the fold.
For example, take a look at the help center of one of our customers, BetterCloud, below. BetterCloud customized their help center with eye-catching icons based on popular support topics. If for some reason the icons are getting a low percentage of clicks, there may be an issue with the relevancy of those topics.

页内分析也是一个很好的方法来测试a new design element or call-to-action. Looking at the BetterCloud example again, you can see they’ve included an upsell opportunity in the icon at the lower-right labeled “Upgrade to Enterprise”. By looking at the percentage of clicks the icon receives, BetterCloud can find out whether or not this type of call-to-action works in their help center.
Should I optimize my help center for mobile devices?
Use this metric:Pages per Session
Pages per Sessionis the average number of pages viewed during a session on your help center. While the overall number is an useful metric to pay attention to, it’s also interesting to look at the devices your customers use to access your help center. As customers grow increasingly mobile-savvy, you can look at pages-per-session through the lens of mobile device usage.
br的报告eaks out pages-per-session by type of device, navigate toAudience>Mobile>Overviewin the Google Analytics dashboard.
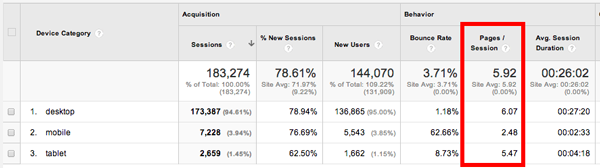
Usually, desktop users have higher pages per session than tablet, and tablet have higher pages per session than mobile. If you notice a high number of customers accessing your help center using mobile devices, you may want to focus your resources on optimizing the navigation experience for mobile. Check out this tip of the week onusing mobile CSS for responsive site design.
13 Comments
In the document you refer toZendesk Benchmark ReportDo you have a more recent version? The one attached to this document is 2013.
Many Thanks
I have a question.
Someone asked the same question about 1 before, but it doesn't help, so I'll ask it again.
1. Could you please tell me how to find the "total number of unique requesters in the ticket"?
2. Regarding the status of the requester, please tell me the type of stator and the timing when the status changes.
Hey@...! To find the "Total number of unique requesters in tickets", you can create a query in Explore by using the metricD_COUNT(End-users)filtering withTicket created - Date(excluding NULL values).
As for your second question, what do you mean by "status of the requester"?
Bumping up Julia's question: any more recent benchmarks you could point us to? The linked document is nearly a decade old
I'd recommend taking a look at ourZendesk Industry Benchmarkspage which I've linked for you.
I hope this helps!
Brett Bowsercan you confirm that's the correct URL? looks like an unrelated comment thread :)
Patrick Morganthis is why coffee is important :) Here's the correct link://www.ying8.net/blog/tags/zendesk-industry-benchmarks/
Sorry about that!
Hi there,
Do you have an updated version of this article for Google Analytics 4?]
Thanks
Yes, we have. Here we go -Enabling Google Analytics for your help center.
Thanks
HiViktor Osetrov.This article is only about setting up GA, which we already have. The article above, Google Analytics and your help center, is focused on the old GA and not GA4.
Noted. One more article about the GA4 announcement -Announcing Google Analytics 4 for Help Center.
Thanks
HeyViktor Osetrov, that article is currently unavailable.
Hi Rafael,
The article provided above has been archived but it is the Announcement for GA4 support rollout. Right now, ourdocumentationfor Google Analytics has been updated and GA4 is now supported.
Thank you.
Pleasesign into leave a comment.