


This report enables you to track satisfaction score year-over-year, by creating multiple date range calculated metrics. This can help you to observe new patterns in both positive and negative customer support feedback.
This article contains the following topics:
What you'll need
Skill level: Intermediate
Time required: 15 mins
- Zendesk Explore Professional or Enterprise
- Editor or Admin permissions (seeGiving agents access to Explore)
- Ticket data in Zendesk Support
Creating the report
- In Explore, click the reports (
 ) icon.
 - In the Reports library, clickNew report.
- On theSelect a datasetpage, click支持>支持- Tickets,然后单击Start report.
- In theCalculationsmenu (
 ), clickDate range calculated metric.
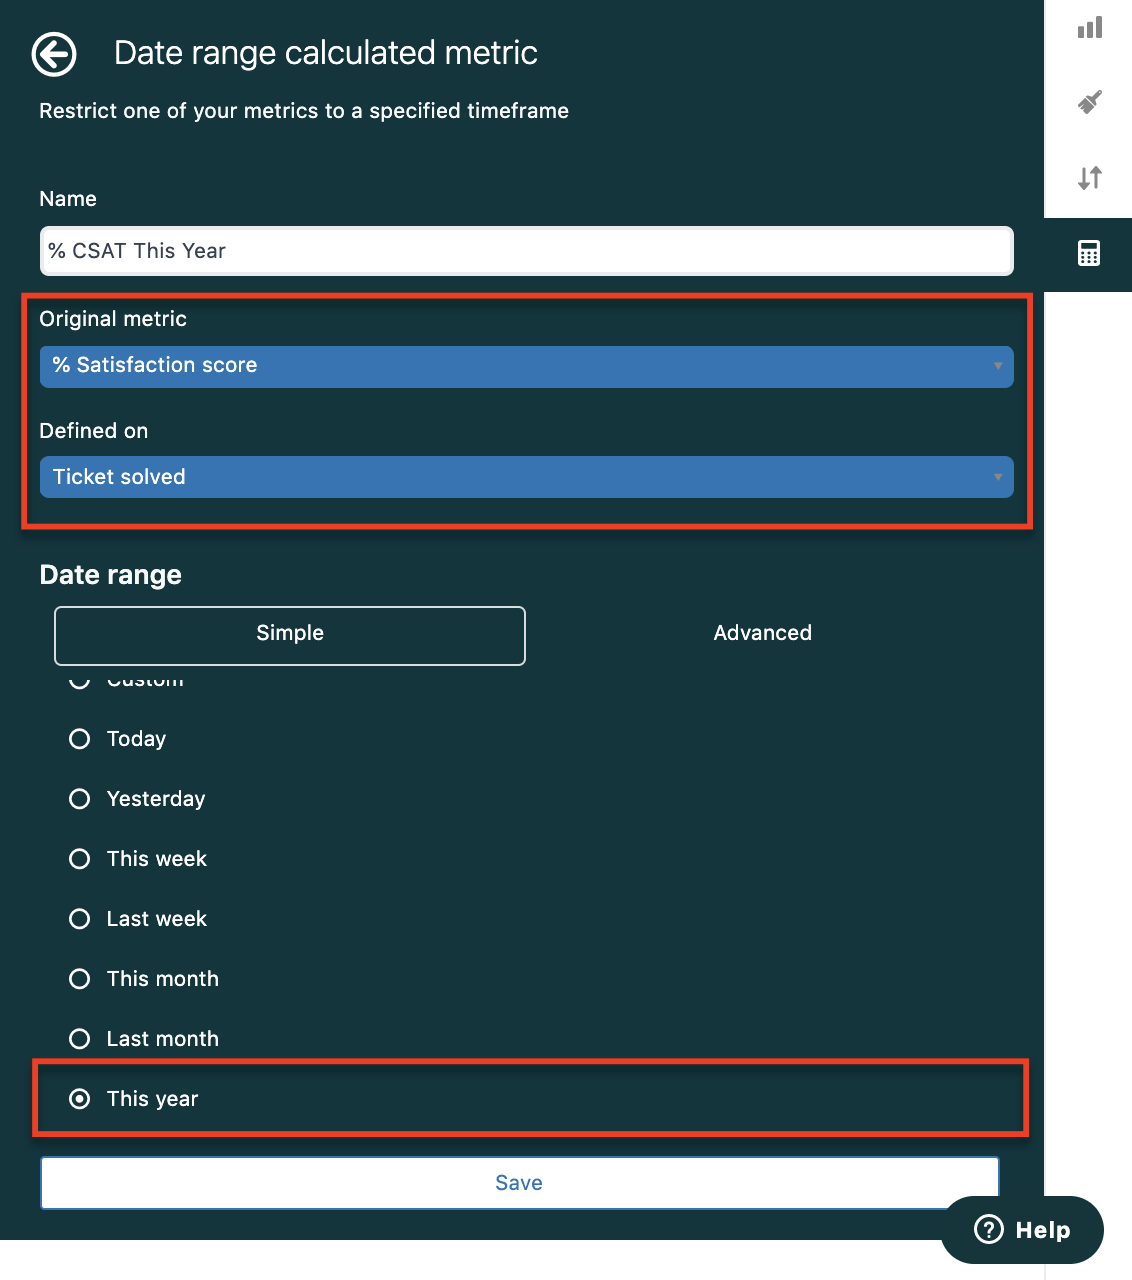
 - On theDate range calculated metricpage, name your metric% CSAT This Year.
- From theOriginal metricdrop-down list, choose% Satisfaction score.
- From theDefined ondrop-down list, chooseTicket solved
- On theSimpletab of theDate rangearea, selectThis year.
- When you are finished, clickSave.
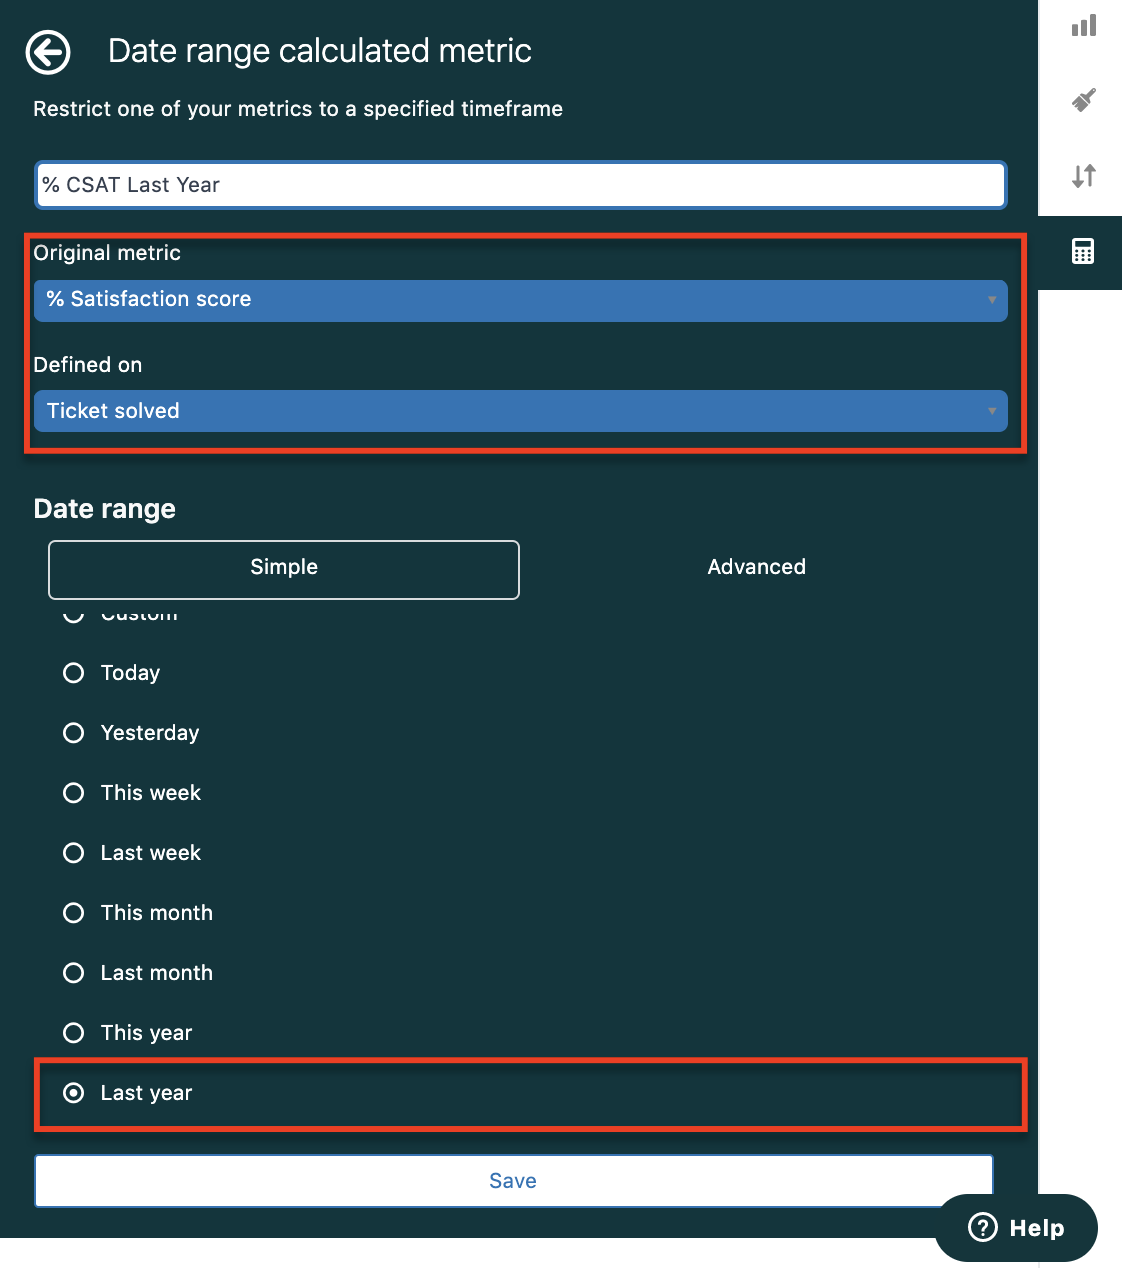
- Now, create a second date range calculated metric named% CSAT Last Year.From theOriginal metricdrop-down list, choose% Satisfaction score.
- From theDefined ondrop-down list, chooseTicket solved.
- On theSimpletab of theDate rangearea, selectLast year.
- When you are finished, clickSave.
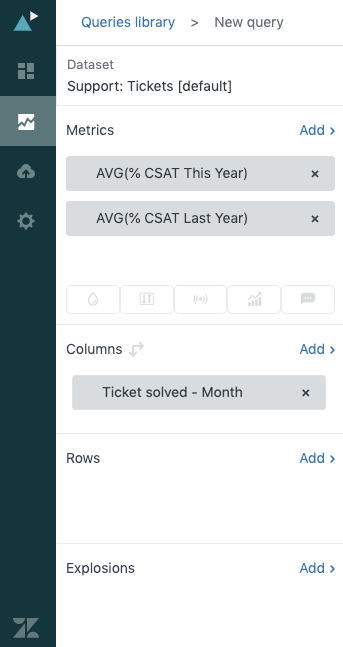
- In theMetricspanel, clickAdd.
- From the list of metrics, expandCalculated metrics, choose both% CSAT This Yearand% CSAT Last Year,然后单击Apply.
- Clickeachmetric and select theAVGaggregator.
- In theColumnspanel, clickAdd.
- From the list of attributes, chooseTicket>Ticket solved - Month,然后单击Apply.The current report setup will match the following:
- From theChart configuration(
 )menu, selectTrend lineand choose a type (linear, polynomial, etc.) for the trend calculation. SeeChart types for comparing trends over timefor more information about trend lines.


You've now finished the report. See the screenshot below as an example of the finished result with % CSAT values and trends over time. You can create additional date range calculated metrics to incorporate data from beyond this year and last year.

5 Comments
Yup I saw that, Is there a reason why you can't do the same for Linear?
Hey Claire,
You're probably best of raising an issue with Zendesk support via in-product messaging if it's not appearing for you. I just checked my test account and it's appearing in mine without any issues in the spot which this guide says it is.
Did you double-check that you're creating the report inside the correct dataset? just double checking you didn't click into the wrong dataset to attempt to create the report?
Best,
Amie
On a linear trend line can you change the color so its not the same as the other graph lines?
I don't see the option to choose % Satisfaction Score under the Original Metric field. What should I choose instead?
Only a constant trend line color can be changed.
Pleasesign into leave a comment.