


You can use Explore to create an overview of your tickets based on specific ticket fields. This information can also becaptured with views, but views don't include archived tickets like Explore does.
In this recipe, you'll create a table focusing on custom ticket fields that can be added to a dashboard, exported, or scheduled. For more on custom fields, seeAdding custom fields to your tickets and support request form.
This article contains the following topics:
What you'll need
Skill level: Beginner
Time required: 10 minutes
- Zendesk Explore Professional or Enterprise
- Editor or Admin permissions (seeGiving users access to Explore)
- Custom ticket fields
- Tickets using those custom ticket fields
Creating the report
Deciding what you want to report on and how
Before you create your report, take a look at your ticket fields and figure out what fields you want to track. In this example, we'll be using the custom field calledWhat Fruit?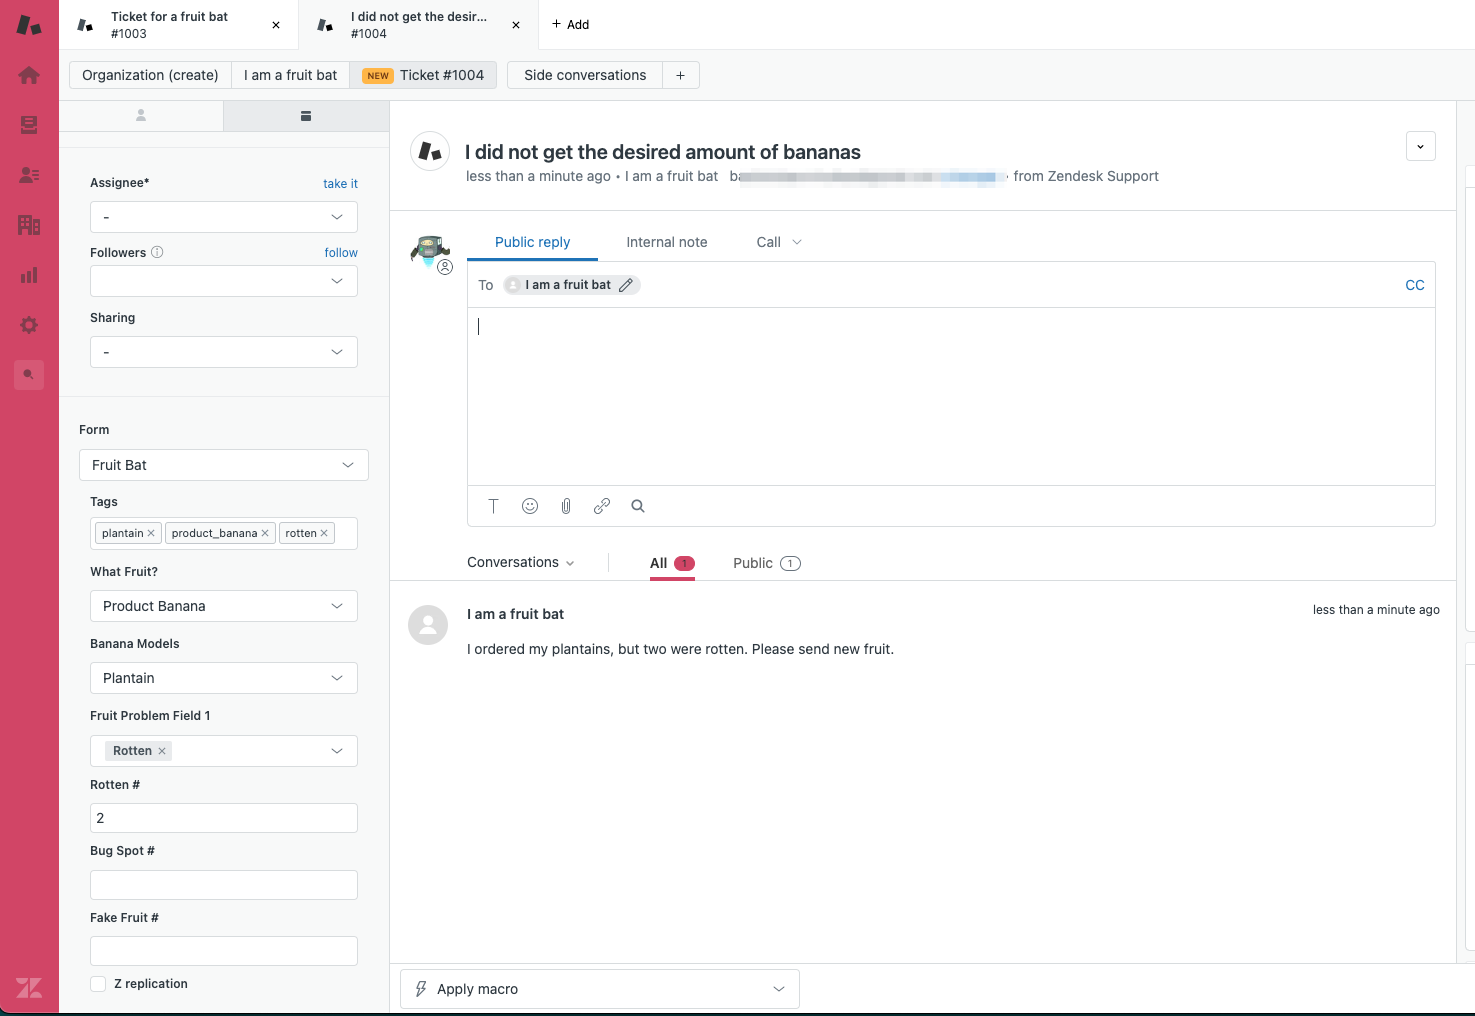
Then, decide how do you want to organize your data. When you create a report in Explore, any attributes you add are sorted from the top down. For example, if you haveTicket groupas your first attribute, any following attributes will first be sorted by ticket group.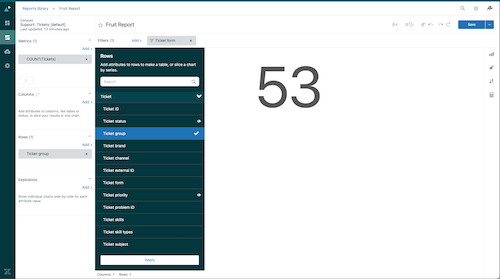
Building the report
- In Explore, click theReports(
 ) icon.
 - In the report library, clickNew report.
- On theSelect a datasetpage, clickSupport>Support - Tickets,然后单击Start report. The report builder opens. (While this example uses theTicketsdataset, you can use whichever dataset includes the data you want to report on).
- In theMetricspanel, clickAdd.
- From the list of metrics, selectTickets>Tickets,然后单击Apply.
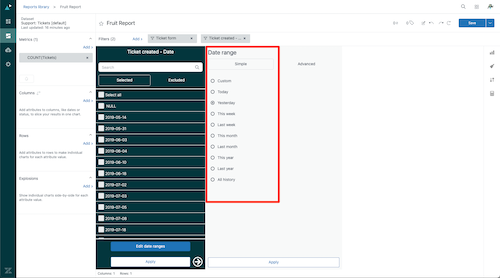
- In theFilterspanel, clickAdd, selectTime created - Date, and apply a time filter for a small period of time, such as a day or week. This prevents the query from timing out while you're building it. The example screenshot below also shows aTicket formfilter.
- In theRowspanel, add the ticket fields you want to report on, such asTicket group,Assignee name, or your custom ticket fields (in this example,What Fruit?).
Tip:You can find all non-numeric custom ticket fields collected together in the menu under theTicket custom fieldsfolder. Numeric custom fields show up in theMetricspanel instead. - In theVisualization type(
 ) menu, set your report's visualization toTable(if it isn't already).
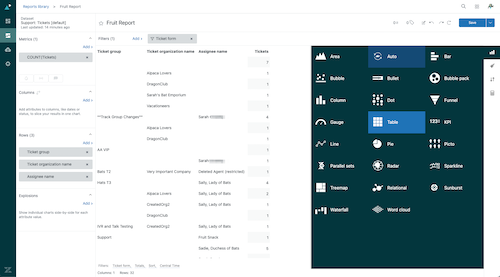
At this point, your report should look something like this: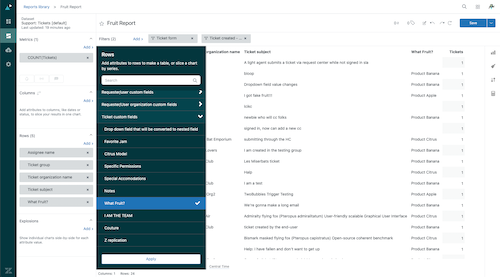
- Add any additional attributes as desired.
Note:There is a limit to the amount of data that Explore can report on at one time. If the report you build is too big, you may receive an error. For more information, seeWhy do I receive a “Network error” in my report? - Give your report a descriptive name and clickSave.


Next steps
Now that you've created your report, you can do any or all of the following:
0 Comments
Pleasesign into leave a comment.